Transform in SQL, Power Query or DAX? Where each step belongs
Comparison · By Tahir Nas · Examples run in our simulator · Updated
11 min read
Put a step as far upstream as it can sensibly go: in the SQL source when it is shared logic the database can do, in Power Query when it shapes data for this model, and in DAX only when the result depends on the filters a report user picks. Row-by-row work is upstream work; anything that has to respond to slicers, such as a ratio or a year-to-date total, is a DAX measure.
The short answer
Ask two questions about each step.
- Does the result depend on what the report user has filtered? If yes, it is a DAX measure. Microsoft describes measures as results that "change as you interact with your reports" (Microsoft Learn: measures in Power BI Desktop). A share of total, a margin percentage or a year-to-date figure cannot be stored in advance, because nobody knows which rows will be in view.
- If not, how far upstream can it go? Fixed, row-level work (cleaning text, splitting columns, mapping codes to categories, removing rows, joining a lookup) belongs in Power Query or in the source. Choose the source when the logic is shared beyond this model or the database does it much faster; otherwise Power Query.
The rest of this post fills in the details behind those two questions. It assumes Import mode, the default for most models; in DirectQuery, Microsoft's folding guidance says every Power Query step must fold, which pushes even more of the work to the source.
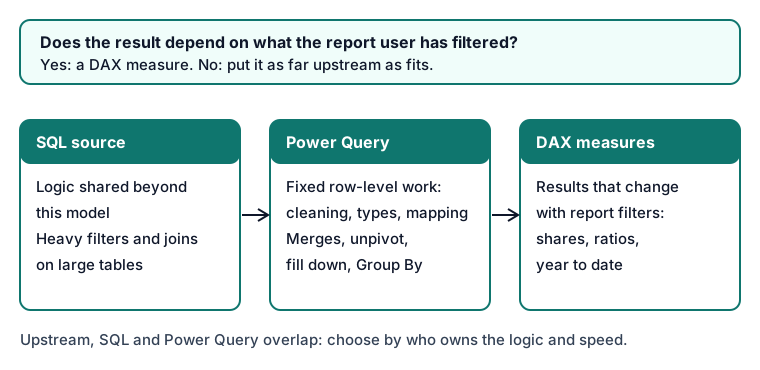
Where each kind of step belongs
| Step | SQL source (view or table) | Power Query | DAX |
|---|---|---|---|
| Filter out test, cancelled or old rows | Yes, if every consumer wants them gone | Yes, and it folds to SQL sources | Only as a report filter, not to remove data |
| Clean text, fix types, trim keys | If the warehouse owns data quality | Yes, the usual place | No |
| Join a lookup or mapping table | Yes, for large tables | Yes, with a merge | Use a relationship instead of a join |
| Row-level arithmetic (margin = amount − cost) | Yes | Yes | Calculated column only if it needs model data |
| Summarise to a coarser grain | Yes | Yes, with Group By | Rarely; measures aggregate at query time |
| Ratios, shares, averages of totals | Only for a fixed, pre-agreed grouping | Only for a fixed, pre-agreed grouping | Yes, as a measure |
| Running totals and time intelligence for report filters | No | Only for a fixed, pre-agreed cut | Yes, as a measure |
| Unpivot, fill down, reshape messy exports | Possible but verbose | Yes | No |
Two patterns stand out. Upstream of the model, SQL and Power Query overlap a lot, and the choice is about ownership and speed. Downstream, DAX does a job neither can do, because measures are evaluated when a visual asks for them. The M vs DAX guide covers the Power Query and DAX boundary in more depth.
When the SQL source is the right place
Microsoft's guidance for Import models is to "delegate as much processing to the data source as possible", and, where steps can't fold, to consider preparing the data in the source: a view that transforms it, or data prepared in advance such as a data warehouse (Microsoft Learn: query folding guidance). Choose SQL when:
- Other tools need the same logic. A view is readable by Power BI, Excel, Python and anything else that speaks SQL. If the team works in Python, Power Query vs Python pandas compares the cleaning side. Logic in a Power Query file is only in that file.
- The table is large and the step is a filter, join or aggregation. Databases are built for these, and only the result travels to Power BI.
- A database team owns the definitions. If "active customer" is defined in the warehouse, reuse it; do not redefine it in every report.
You do not always have to write SQL to get this benefit. When Power Query steps fold, Power Query writes the SQL for you. A filter like this one, placed straight after the navigation step on a SQL source, is sent to the database as a WHERE clause:
let
    Orders = #table(
        type table [OrderID = Int64.Type, Status = text, Amount = number],
        {{1, "Complete", 120}, {2, "Cancelled", 80}, {3, "Complete", 45}, {4, "Test", 1}}
    ),
    Completed = Table.SelectRows(Orders, each [Status] = "Complete"),
    Kept = Table.SelectColumns(Completed, {"OrderID", "Amount"})
in
    Kept
Result
| OrderID | Amount |
|---|---|
| 1 | 120 |
| 3 | 45 |
Output produced by the Power Query Exercises simulator, an independent implementation of a documented subset of M.
Orders 1 and 3 remain, with only the OrderID and Amount columns. Against a database, both steps fold, so the database does the filtering and column selection. The query folding lesson explains which steps fold, and the SQL to Power Query M guide maps common SQL clauses to their M equivalents.
If you write the SQL yourself
When a step can't fold, Microsoft suggests a native SQL query and recommends passing parameters with Value.NativeQuery. The same page warns that later Power Query steps won't fold after a native query, so the query should hold as much of the logic as possible (Microsoft Learn: query folding guidance). For SQL Server and a few other connectors there is an exception: passing [EnableFolding = true] to Value.NativeQuery keeps folding active for the steps after it (Microsoft Learn: query folding on native queries). For incremental refresh, the folding guidance warns that a native query makes the engine read every row, while Microsoft's incremental refresh overview shows a native query working when RangeStart and RangeEnd are written into the SQL itself; the incremental refresh post covers that case.
let
    Source = Sql.Database("sql-server-name", "SalesDW"),
    Orders = Value.NativeQuery(
        Source,
        "SELECT OrderID, Amount FROM dbo.Orders WHERE Status = @status",
        [status = "Complete"]
    )
in
OrdersThe same page reminds you to use an account with read-only permission, because a native query can run any statement, including ones that change data.
When Power Query is the right place
Power Query is the right place for shaping that is specific to this model, or that SQL handles badly:
- Cleaning exports and files. Promoting headers, removing report banners, unpivoting month columns and filling down are natural in Power Query and awkward in SQL. Files and folders have no SQL engine to push work to anyway.
- Combining sources. A spreadsheet of targets joined to a database table, or several CSV files appended into one table.
- Row-level columns. Microsoft's data reduction guidance says it is less efficient to add columns as DAX calculated columns than as Power Query columns, because calculated columns typically compress less well and are built after all Power Query tables load (Microsoft Learn: data reduction techniques).
A margin column is a good example. Each row's margin depends only on that row, so it can be computed once at refresh:
let
    Sales = #table(
        type table [Region = text, Amount = number, Cost = number],
        {{"North", 1000, 600}, {"North", 100, 90}, {"South", 400, 200}}
    ),
    WithMargin = Table.AddColumn(Sales, "Margin", each [Amount] - [Cost], type number),
    WithPct = Table.AddColumn(WithMargin, "MarginPct", each [Margin] / [Amount], type number)
in
    WithPct
Result
| Region | Amount | Cost | Margin | MarginPct |
|---|---|---|---|---|
| North | 1000 | 600 | 400 | 0.4 |
| North | 100 | 90 | 10 | 0.1 |
| South | 400 | 200 | 200 | 0.5 |
Output produced by the Power Query Exercises simulator, an independent implementation of a documented subset of M.
The margins are 400, 10 and 200. The MarginPct column (0.4, 0.1 and 0.5) is correct for each single row, which is exactly why it is dangerous, as the next section shows. The conditional columns lesson covers row-level logic with if … then … else.
When DAX is the only right place
Some numbers are not properties of a row; they are properties of whatever set of rows is currently in view. Ratios are the classic case.
The ratio trap
Suppose the report shows margin percentage by region. If you average the per-row percentages from Power Query, North's two rows give 40% and 10%, averaging 25%. But North actually earned 410 margin on 1,100 of sales, which is about 37.3%.
let
    Sales = #table(
        type table [Region = text, Amount = number, Cost = number],
        {{"North", 1000, 600}, {"North", 100, 90}, {"South", 400, 200}}
    ),
    WithPct = Table.AddColumn(Sales, "MarginPct", each ([Amount] - [Cost]) / [Amount], type number),
    North = Table.SelectRows(WithPct, each [Region] = "North"),
    Compare = #table(
        {"Method", "North margin %"},
        {
            {"Average of row percentages", Number.Round(List.Average(North[MarginPct]) * 100, 1)},
            {"Total margin / total amount", Number.Round((List.Sum(North[Amount]) - List.Sum(North[Cost])) / List.Sum(North[Amount]) * 100, 1)}
        }
    )
in
    Compare
Result
| Method | North margin % |
|---|---|
| Average of row percentages | 25 |
| Total margin / total amount | 37.3 |
Output produced by the Power Query Exercises simulator, an independent implementation of a documented subset of M.
The simulator returns 25 for the average of row percentages and 37.3 for total margin divided by total amount. The small order counts as much as the large one in the first method, which is rarely what anyone means by "margin %".
You could compute the correct 37.3% in Power Query with a Group By, but only for the grouping you chose in advance. The moment a user filters to one product or one month, the stored figure is wrong again. A DAX measure divides the totals for whatever is in view:
Margin % = DIVIDE ( SUM ( Sales[Amount] ) - SUM ( Sales[Cost] ), SUM ( Sales[Amount] ) )So the split is: Power Query supplies clean Amount and Cost columns; DAX does the division at query time. The same reasoning applies to shares of total, averages per customer, distinct counts across a filtered range, year-to-date and prior-year comparisons. To practise the fixed-grouping version, try showing each region's share of total revenue: it builds the share for one grouping, by region, in Power Query, which is correct only as long as nobody filters the result.
DAX calculated columns: the narrow case
A DAX calculated column is evaluated per row and, in Import mode, stored at refresh, like a Power Query column (Microsoft Learn: calculated columns). Microsoft's data reduction guidance (Microsoft Learn: data reduction techniques) says it can still be the better choice when the formula evaluates measures or needs modelling functions only DAX has, such as parent-child hierarchy functions. Otherwise, add the column in Power Query.
A worked split for one sales model
Here is how the steps of a typical sales model divide up:
| Step | Placement | Reason |
|---|---|---|
| Exclude test and cancelled orders | SQL view, or a folding Power Query filter | Shared rule; database does it fastest |
| Join product category from the product table | Model relationship | Keeps both tables usable; no need to widen the fact table |
| Trim and upper-case customer codes | Power Query | Cleaning for this model |
| Map region codes to region names | Power Query merge with a mapping table | Fixed, row-level |
| Margin per row | Power Query column | Row-level, fixed |
| Margin % | DAX measure | Ratio that depends on the filter |
| Year-to-date sales | DAX measure | Depends on the date in view |
If a second model needs the same cleaned tables, the Power Query rows move upstream again, into a view or a dataflow. The Desktop or dataflows comparison covers that decision.
Frequently asked questions
Is Power Query slower than SQL?
For filters, joins and aggregations on a large database table, doing the work in the database is usually faster, and folding gives you that without writing SQL. For files, spreadsheets and small lookups, the choice makes little difference. Microsoft's folding guidance (Microsoft Learn: query folding guidance) says best refresh performance for an Import table on a relational source comes from making sure the query folds.
Can I avoid DAX altogether?
For fixed tables, yes: everything can be calculated in Power Query and loaded as columns. As soon as a report needs a ratio or a total that responds to slicers, you need a measure. Even a simple sum in a visual is an aggregation the model performs when the visual asks for it.
Should I move my calculated columns to Power Query?
Usually, if they only use values from the same row or from a lookup Power Query can merge. Keep them in DAX when they depend on measures or model-only functions. Moving them can also reduce model size; the file size post covers that side.
Practise the upstream half
The skill that makes this decision easy is writing Power Query steps that do one clear job each, so you can see which ones could move to SQL and which belong in the model. Practise row-level logic and fixed groupings in the group by and aggregation exercises, then compare your query with the query folding diagnosis guide to see which steps would reach the database. Power Query Exercises runs each check in the browser, so you can test the M side of the split before touching a model.
Sources
- Microsoft Learn: measures in Power BI Desktop (learn.microsoft.com)
- Microsoft Learn: query folding guidance (learn.microsoft.com)
- Microsoft Learn: query folding on native queries (learn.microsoft.com)
- Microsoft Learn: data reduction techniques (learn.microsoft.com)
- Microsoft Learn: calculated columns (learn.microsoft.com)
About the author
Tahir Nas, software engineer, writes and reviews the lessons, guides and exercises on Power Query Exercises. Tahir has 8 years of experience in tech, working across system administration, cloud architecture, QA, scripting and automation, and software engineering in many languages and mainstream databases. GitHub profile. Every M example shown with a result was run in the site's simulator when the page was built, and the output is that run's result; examples marked for Excel and Power BI only are shown without output. How content is tested.
Keep reading
- Incremental refresh in Power BI: what your Power Query must get rightThe Power Query side of incremental refresh: RangeStart and RangeEnd, a half-open date filter, date vs datetime columns, integer date keys and query folding.
- Reduce Power BI file size with Power QueryShrink a Power BI model before it loads: keep needed columns and rows, summarise, split high-cardinality columns, fix types and stop staging queries loading.
- Load to a table or the Data Model? Choosing where Power Query results goWhen to load a Power Query result to a worksheet table, to the Data Model or as connection only, with the limits, trade-offs and steps to switch.
Practise Power Query in the browser with graded exercises checked against fresh data.
Power Query Exercises is an independent educational platform and is not affiliated with, endorsed by, sponsored by, or approved by Microsoft Corporation. All third-party trademarks belong to their respective owners.