Power BI Desktop or dataflows: where should Power Query steps live?
Comparison · By Tahir Nas · Examples run in our simulator · Updated
12 min read
Put a Power Query step in a dataflow when more than one semantic model needs its result, and keep it in the Power BI Desktop file when only that model needs it. Most models end up with both: shared extraction and cleaning upstream in a dataflow, and report-specific filtering and shaping downstream in the semantic model.
The short answer
The question is not "dataflows vs Power Query". Both are Power Query. Microsoft describes dataflows as authored with Power Query and run in the cloud, with Power Query as the transformation engine (Microsoft Learn: dataflows across Power Platform). The real question is where a given step runs and who else can use its output.
A useful rule of thumb:
- Upstream (dataflow): connecting to the source, removing junk rows, fixing types, standardising keys and names, deduplicating. Work that every consumer of the table would otherwise repeat.
- Downstream (Desktop): filters, column choices and groupings that exist because of one report's audience or one visual's needs.
If you are not sure, start in Desktop. Moving a query later is easy; maintaining a dataflow nobody else reads is not free.
What a dataflow is
A dataflow is a set of Power Query queries saved in a Power BI workspace. When it refreshes, each query's result is stored as a table, and Power BI Desktop can connect to those tables through Get data > Dataflows (Microsoft Learn: configure and consume a dataflow). Microsoft lists the main reason for them as reusable transformation logic "that many semantic models and reports can share" (Microsoft Learn: introduction to dataflows).
There are two generations. The original Power BI dataflow is now called Dataflow Gen1, and Microsoft's pages mark it as legacy with no new feature investment (Microsoft Learn: introduction to dataflows). Dataflow Gen2 is the Fabric version; it can write to other destinations such as a lakehouse or warehouse, and it requires a Fabric capacity, a Fabric trial capacity or a Power BI Premium capacity (Microsoft Learn: Gen1 vs Gen2). The placement question in this post is the same for both.
Desktop vs dataflow, side by side
| Steps in the Power BI Desktop file | Steps in a dataflow | |
|---|---|---|
| Where the steps run | Inside the semantic model refresh (on your PC while authoring, in the service after publishing) | In the Power BI service, as its own refresh |
| Who can reuse the result | That semantic model only | Any model or dataflow whose author can see the workspace |
| Refresh schedule | One schedule for the whole model | Its own schedule, which can differ per dataflow |
| Editor | Power Query Editor in Desktop | Power Query Online in the browser |
| Changing the logic | Edit, then republish one file | Edit once; every consumer picks up the change on its next refresh |
| What breaks if it fails | One semantic model and its reports | Every model that imports the table |
| Good for | Report-specific shaping, prototypes, one-off analysis | Shared dimensions (customers, products, dates), slow source extracts, a single agreed definition |
Two rows in that table do most of the deciding: who reuses the result, and what breaks if it fails. A dataflow is a promise to other people. That is its value and also its cost.
Keep the steps in Power BI Desktop when
Only one semantic model uses the table. If several reports need the same table, publish one shared semantic model and build the reports on it; that needs no dataflow. A dataflow adds a workspace item, a second refresh and a second place to look when numbers are wrong. If no other model reads the table, you pay that cost for nothing.
You are still working out the logic. The Desktop editor shows results quickly against your own copy of the data, and the whole query, model and report sit in one file. Prototype there first. Read the M as you go (read the M behind the Applied Steps) so the query is easy to move later.
The step depends on the report. "Active customers in the North region for the regional sales pack" is a report decision. Put it in the report, not in a shared table, or every other consumer inherits a filter they did not ask for.
A report filter needs to fold to the database. When a query reads a database directly, filters and column choices can fold back to the source, so the database sends fewer rows (Microsoft Learn: query folding). A dataflow's own steps can fold to its source too. The catch is downstream: a filter you add in Desktop on top of an imported dataflow table runs against the stored table, not the original database. If a model only needs last month's rows from a very large table, either put that filter in the dataflow or keep the query on the database connection. For dataflows that chain together, Microsoft notes that dataflows don't support query folding for linked tables that reference another dataflow (Microsoft Learn: configure and consume a dataflow). The query folding concept lesson explains what is at stake.
Move the steps to a dataflow when
A second semantic model starts copying the query. This is the clearest signal. Microsoft's reuse guidance says the best candidates to move are tables "used in more than one solution", with a shared date table as the example (Microsoft Learn: reusing dataflows). Two copies of the same cleaning logic drift apart; one dataflow gives one answer.
The source is slow, fragile or rationed. If five models each pull the same table from an overloaded source, the source sees five extracts. With a dataflow it sees one, and the models read the stored result. Microsoft lists reduced load on source systems as one of the reasons for dataflows (Microsoft Learn: introduction to dataflows).
You want report authors to stop connecting to the source. A dataflow can be the only thing analysts are given access to, which keeps credentials and gateway settings in one place.
Tables need different refresh rhythms. Microsoft's example is a sales table refreshed every four hours, a date table once a day and a product mapping table once a week, split into separate dataflows so each can have its own schedule (Microsoft Learn: reusing dataflows).
Split one query into a shared part and a report part
The cleanest pattern is the same staging idea you use inside a single file, stretched across two items. The lesson on staging and reuse covers it inside one workbook; here the staging query becomes the dataflow.
The shared part, in the dataflow
This query does work that any report would need: trim and upper-case the keys, tidy the text, remove duplicate customers. It has no report-specific filter.
let
    Source = #table(
        {"CustomerID", "Name", "Region", "Status"},
        {
            {" c-001", "Ada Lovelace ", "north", "Active"},
            {"C-002", "grace hopper", "South", "active"},
            {"c-003 ", "Alan Turing", "NORTH", "Closed"},
            {"c-002 ", "Grace Hopper", "south", "Active"}
        }
    ),
    CleanIds = Table.TransformColumns(Source, {{"CustomerID", each Text.Upper(Text.Trim(_)), type text}}),
    CleanText = Table.TransformColumns(CleanIds, {
        {"Name", each Text.Proper(Text.Trim(_)), type text},
        {"Region", each Text.Proper(_), type text},
        {"Status", each Text.Proper(_), type text}
    }),
    Deduplicated = Table.Distinct(CleanText, {"CustomerID"}),
    Typed = Table.TransformColumnTypes(Deduplicated, {{"CustomerID", type text}, {"Name", type text}, {"Region", type text}, {"Status", type text}})
in
    Typed
Result
| CustomerID | Name | Region | Status |
|---|---|---|---|
| C-001 | Ada Lovelace | North | Active |
| C-002 | Grace Hopper | South | Active |
| C-003 | Alan Turing | North | Closed |
Output produced by the Power Query Exercises simulator, an independent implementation of a documented subset of M.
The result is three customers, C-001 to C-003, with names and regions in proper case. The second C-002 row is removed because the keys only match after trimming and upper-casing, which is why cleaning comes before Table.Distinct. The last step sets the column types the dataflow will store. In a real dataflow the Source step would be the database or file connection instead of #table.
The report part, in Desktop
The report's query starts from the dataflow table (here typed inline so it runs) and applies only what this report needs.
let
    Customers = #table(
        type table [CustomerID = text, Name = text, Region = text, Status = text],
        {
            {"C-001", "Ada Lovelace", "North", "Active"},
            {"C-002", "Grace Hopper", "South", "Active"},
            {"C-003", "Alan Turing", "North", "Closed"}
        }
    ),
    ActiveOnly = Table.SelectRows(Customers, each [Status] = "Active"),
    ForThisReport = Table.SelectColumns(ActiveOnly, {"CustomerID", "Region"})
in
    ForThisReport
Result
| CustomerID | Region |
|---|---|
| C-001 | North |
| C-002 | South |
Output produced by the Power Query Exercises simulator, an independent implementation of a documented subset of M.
It returns two rows, C-001 (North) and C-002 (South). Another report could read the same three-row table and keep closed customers, without touching the shared logic.
The refresh chain is the main new risk
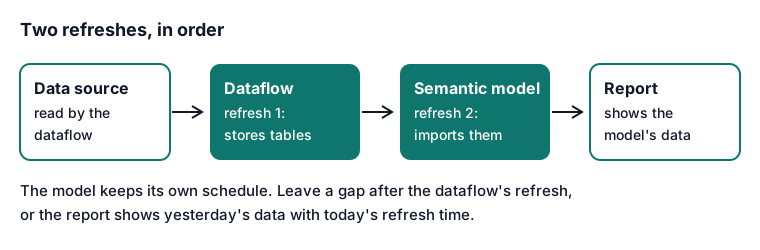
When Desktop imports a dataflow table, the data is copied into the semantic model. Microsoft states that import "requires the semantic model to be refreshed independently of the dataflow" (Microsoft Learn: configure and consume a dataflow). So there are two refreshes and the order matters:
- The dataflow refreshes and stores new tables.
- The semantic model refreshes and imports them.
If the model refreshes before the dataflow finishes, the report shows yesterday's data with today's timestamp. Leave enough gap between the two schedules, and check the dataflow's refresh history when figures look stale. Microsoft also notes a dataflow must be refreshed before a model can consume it (Microsoft Learn: configure and consume a dataflow). The refresh lesson covers how refresh differs between Desktop and the service.
Linked tables between dataflows behave differently: when a source dataflow's scheduled refresh completes, Power BI triggers the dataflows in the same workspace that reference it (Microsoft Learn: configure and consume a dataflow). That chaining stops at the semantic model, which keeps its own schedule.
What changes when a query moves
The M itself mostly moves unchanged. You can copy a query from Desktop's Advanced Editor and paste it into Power Query Online. These are the parts that do change:
- The source step. The Desktop query's first steps become a navigation to the dataflow table, generated for you when you pick it in Get data > Dataflows. Everything after that point is report logic.
- Credentials and gateways. The dataflow needs its own data source credentials and, for on-premises sources, a gateway connection, set in the dataflow's settings. The Dataflows connector in Desktop also uses its own set of credentials, separate from the account you are logged in with (Microsoft Learn: configure and consume a dataflow).
- Types at the boundary. Set column types as the last step of the dataflow query. Desktop reads the stored table with those types, so a text ID stays text.
- Parameters. A parameter in Desktop does not reach into the dataflow. If the dataflow needs a date window or a source switch, it needs its own parameters (parameters: one value, many queries). The post on switching between test and production sources shows the source switch in Desktop.
- Ownership. Someone has to own the dataflow, endorse it if it is the agreed version, and tell consumers before changing a column. Microsoft's reuse guidance describes promoted and certified endorsement for this purpose (Microsoft Learn: reusing dataflows).
A checklist before you move a query
- At least two semantic models need this table (and a shared semantic model would not do the job), or the source cannot take repeated extracts.
- The query contains no report-specific filters (move those down into the report).
- Column names and types are final, and set in the last step.
- The query runs without errors from top to bottom.
- The dataflow's refresh is scheduled before every dependent model's refresh.
- Each consuming model has been switched to the dataflow table and its old source steps removed.
- Someone is named as owner.
Frequently asked questions
Can I use the same M in a dataflow and in Desktop?
Yes. Both are Power Query and use the M language, so a query copied from Desktop's Advanced Editor pastes into Power Query Online. Connectors and a few features vary between hosts, so test the pasted query once before relying on it.
Do dataflows make a report faster?
They can make the semantic model's refresh shorter, because the model imports a table that is already cleaned instead of doing the work itself. They do not change how fast visuals respond once the data is imported. For slow transformation steps, look at folding and step order first. For a large fact table, incremental refresh can also limit each refresh to recent rows.
Should calculations go in the dataflow too?
Row-level columns that every consumer needs, yes. Measures that depend on filters in a report belong in DAX in the semantic model. The M vs DAX guide sets out where each calculation belongs, and Transform in SQL, Power Query or DAX? adds the database to that decision.
Practise the split before you need it
The habit that makes this decision easy is writing queries in two clear parts: a staging part that cleans and a final part that shapes for one purpose. Practise it in the refresh and performance exercises, then try switching a source query with a parameter. Power Query Exercises runs every exercise in the browser, so you can practise the pattern without a Power BI workspace.
Sources
- Microsoft Learn: dataflows across Power Platform (learn.microsoft.com)
- Microsoft Learn: configure and consume a dataflow (learn.microsoft.com)
- Microsoft Learn: introduction to dataflows (learn.microsoft.com)
- Microsoft Learn: Gen1 vs Gen2 (learn.microsoft.com)
- Microsoft Learn: query folding (learn.microsoft.com)
- Microsoft Learn: reusing dataflows (learn.microsoft.com)
About the author
Tahir Nas, software engineer, writes and reviews the lessons, guides and exercises on Power Query Exercises. Tahir has 8 years of experience in tech, working across system administration, cloud architecture, QA, scripting and automation, and software engineering in many languages and mainstream databases. GitHub profile. Every M example shown with a result was run in the site's simulator when the page was built, and the output is that run's result; examples marked for Excel and Power BI only are shown without output. How content is tested.
Keep reading
- Transform in SQL, Power Query or DAX? Where each step belongsDecide whether a Power BI transformation belongs in the SQL source, in Power Query or in DAX, with a placement table, tested M examples and the ratio trap.
- Handle changing column headers from a source system in Power QueryStop refreshes failing when a source renames or adds columns: clean names, rename from a mapping table, check the schema early, then select and type by rule.
- How to refresh Power Query automatically in ExcelRefresh Power Query when an Excel workbook opens, every few minutes or on a timer with VBA, and make the queries safe to refresh when nobody is watching.
Practise Power Query in the browser with graded exercises checked against fresh data.
Power Query Exercises is an independent educational platform and is not affiliated with, endorsed by, sponsored by, or approved by Microsoft Corporation. All third-party trademarks belong to their respective owners.