Load to a table or the Data Model? Choosing where Power Query results go
Comparison · By Tahir Nas · Examples run in our simulator · Updated
9 min read
Load a Power Query result to a table on a worksheet when people need to read the rows, filter them or point formulas at them, and the data fits comfortably on a sheet. Load it to the Data Model when the data is too large for a sheet, or when several related tables feed one PivotTable; and load helper queries as connection only, so they run without landing anywhere.
The choices in the Import Data dialog
When you select Home > Close & Load > Close & Load To in the Power Query Editor, Excel opens the Import Data dialog. Microsoft's article on creating, loading and editing a query in Excel describes it as the place to choose between a worksheet and the Data Model. You pick one way to view the data:
- Table: the rows land in an Excel table on a sheet.
- PivotTable Report or PivotChart: Excel builds a pivot over the result without putting the rows on a sheet.
- Only Create Connection: the query is saved and can be refreshed, but nothing is placed in the grid.
Separately, the Add this data to the Data Model check box sends the result into the workbook's Data Model. It combines with any of the choices above, so "Only Create Connection" plus the check box gives you a Data Model table with nothing on a sheet. For a map of where Close & Load To, Load To and the other query settings sit in Excel, see the guide to managing Power Query queries in Excel.
Microsoft's article also gives the defaults: a single query loads to a new worksheet, and several queries loaded at the same time go to the Data Model. You can change those defaults under File > Options and settings > Query Options > Data Load.
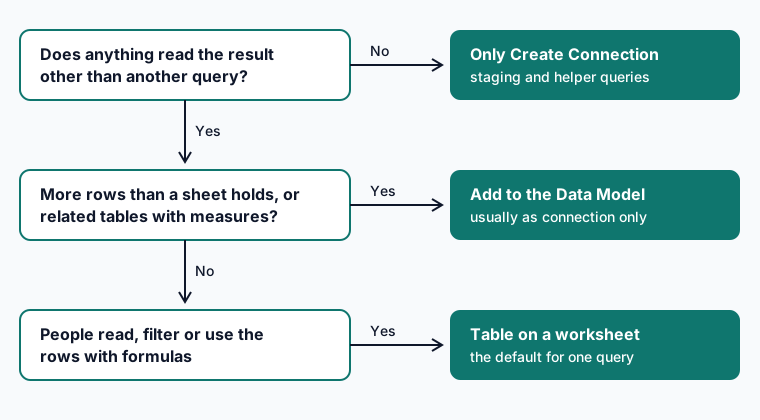
Table or Data Model, side by side
| Table on a worksheet | Data Model | |
|---|---|---|
| Row limit | 1,048,576 rows per sheet, including the header row | 1,999,999,997 rows per table |
| Where you see the data | In the grid, like any other table | In PivotTables, PivotCharts and Power Pivot > Manage |
| Formulas | Lookups and structured references work directly | Calculations are DAX measures and calculated columns |
| Several related tables | Merge them in Power Query first | Keep them separate and relate them by key |
| File size | Grows with the rows on the sheet | Adds to file size; Microsoft suggests leaving it off when not needed |
| Background refresh | Available | Not available for Data Model connections |
The row limits come from Microsoft's Excel specifications and limits and Data Model specification and limits pages. The background refresh restriction is in Microsoft's article on refreshing an external data connection, which says you can't run a background query for any connection that retrieves data for the Data Model.
When a table on a worksheet is the right choice
A worksheet table suits results that people use as a list. Typical cases are a cleaned customer list that someone filters, a reconciliation where each unmatched row needs a comment, or a lookup table that formulas elsewhere in the workbook read. A sheet also applies its own cell formats, which is how dates turn into numbers after loading when a column has no Date type.
Because the result is a flat table, any lookup values must already be on each row. If sales rows carry a product code and the report needs the product name and category, merge the product table in Power Query before loading:
let
    Sales = #table(type table [OrderID = text, ProductID = text, Units = Int64.Type], {{"O-1001", "P1", 3}, {"O-1002", "P2", 1}, {"O-1003", "P1", 2}}),
    Products = #table(type table [ProductID = text, Product = text, Category = text], {{"P1", "Kite", "Outdoor"}, {"P2", "Reel", "Accessories"}}),
    Merged = Table.NestedJoin(Sales, {"ProductID"}, Products, {"ProductID"}, "Product", JoinKind.LeftOuter),
    Flat = Table.ExpandTableColumn(Merged, "Product", {"Product", "Category"})
in
    Flat
Result
| OrderID | ProductID | Units | Product | Category |
|---|---|---|---|---|
| O-1001 | P1 | 3 | Kite | Outdoor |
| O-1002 | P2 | 1 | Reel | Accessories |
| O-1003 | P1 | 2 | Kite | Outdoor |
Output produced by the Power Query Exercises simulator, an independent implementation of a documented subset of M.
The result has three rows with Product and Category added: both P1 orders show Kite and Outdoor, and the P2 order shows Reel and Accessories. Table.NestedJoin does the match and Table.ExpandTableColumn brings the chosen columns onto each row.
A table is also the right place for a summary that people read directly. Grouping before the load keeps the sheet small and the refresh quick:
let
    Sales = #table(type table [Month = text, Region = text, Units = Int64.Type], {{"2026-09", "North", 3}, {"2026-09", "North", 5}, {"2026-09", "South", 2}, {"2026-10", "North", 4}, {"2026-10", "South", 6}}),
    Summary = Table.Group(Sales, {"Month", "Region"}, {{"Units", each List.Sum([Units]), Int64.Type}, {"Orders", each Table.RowCount(_), Int64.Type}})
in
    Summary
Result
| Month | Region | Units | Orders |
|---|---|---|---|
| 2026-09 | North | 8 | 2 |
| 2026-09 | South | 2 | 1 |
| 2026-10 | North | 4 | 1 |
| 2026-10 | South | 6 | 1 |
Output produced by the Power Query Exercises simulator, an independent implementation of a documented subset of M.
Five order rows become four summary rows; North in September shows 8 units from 2 orders. If you would rather keep the detail and let a PivotTable summarise it, that points towards the Data Model instead.
When the Data Model is the right choice
Microsoft's article on creating a Data Model in Excel describes the Data Model as a relational data source inside the workbook, used by PivotTables and PivotCharts. Choose it when one of these holds:
- The data is too big for a sheet. Past about a million rows a worksheet table is not an option at all, and well before that a sheet full of rows makes the workbook slow to open and save.
- You have several related tables. A sales table, a product table and a date table can stay separate and be joined by relationships, instead of being merged into one wide table. The guide to building a date table in Power Query produces the kind of table that sits well in a model.
- You need measures. Measures written in DAX calculate inside the PivotTable, so a ratio or a year-to-date figure stays correct at every level of the pivot. The guide on Power Query M vs DAX explains which work belongs in each language.
For these cases the usual setting is Only Create Connection with Add this data to the Data Model ticked. The rows then live only in the model, not twice in the file.
Two limits are worth knowing before you build a large model. Microsoft's specifications page says that in 32-bit Excel the whole process shares 2 GB of address space, and a Data Model's share might run to 500 to 700 MB; 64-bit Excel has no hard file size limit beyond available memory and disk. If a model is struggling in 32-bit Excel, switching to 64-bit can be the real fix. In Power BI, loading less is also the first step to reduce a model's file size.
Connection only for helper queries
Many workbooks have queries that exist only to feed others: a cleaned source that two reports reference, a parameter value, or a function. Loading those to a sheet adds rows nobody reads and a second refresh of the same data. Load them as Only Create Connection without the Data Model box. A prefix from a naming convention for queries and steps makes these helper queries easy to spot.
This is the staging query pattern: one query connects and cleans, and the queries that reference it do the report-specific work. Only the final queries load anywhere.
How to change where a query loads
You are not locked in. Microsoft's steps for an existing query are:
- Select Data > Queries & Connections and open the Queries tab.
- Right-click the query and select Load To.
- Choose the new destination in the Import Data dialog and select OK.
Microsoft notes that Load To is sometimes greyed out the first time you create a query in a workbook. In that case, select Close & Load, then use Load To from the Queries & Connections pane as above.
When you move a query from a sheet to connection only, Excel deletes the table it had loaded (it warns you first). Check that no formulas pointed at that table first, or they will return #REF! errors.
A rule of thumb
Ask three questions in order. Does anything other than another query read this result? If not, choose connection only. Does it need more rows than a sheet holds, or relationships and measures across tables? If so, add it to the Data Model. Otherwise, load it to a table on a sheet. The lesson on refresh in Excel, Power BI Desktop and the service covers what happens to each destination when the workbook refreshes, and the post on refreshing Power Query automatically in Excel covers the refresh settings themselves.
To practise shaping a result before it loads, try the merging tables exercises and the Group By and aggregation exercises on Power Query Exercises.
Frequently asked questions
Can I load the same query to a table and the Data Model?
Yes. Choose Table and tick Add this data to the Data Model. The rows are then stored twice, once on the sheet and once in the model, so only do it when both copies have a use.
Why does loading to the Data Model take much longer than loading to a sheet?
Microsoft's query article names one cause: filtering a text column, or a list column, with a Contains condition can make Excel enumerate the whole data set for each row when loading to the Data Model. It suggests trying Equals or Begins With instead. The guide to speeding up slow refreshes covers other causes.
How do I tell whether a workbook already has a Data Model?
Microsoft's tip is to select Power Pivot > Manage. If you see tables of data in the Power Pivot window, a model exists.
Sources
- creating, loading and editing a query in Excel (support.microsoft.com)
- Excel specifications and limits (support.microsoft.com)
- Data Model specification and limits (support.microsoft.com)
- refreshing an external data connection (support.microsoft.com)
- creating a Data Model in Excel (support.microsoft.com)
About the author
Tahir Nas, software engineer, writes and reviews the lessons, guides and exercises on Power Query Exercises. Tahir has 8 years of experience in tech, working across system administration, cloud architecture, QA, scripting and automation, and software engineering in many languages and mainstream databases. GitHub profile. Every M example shown with a result was run in the site's simulator when the page was built, and the output is that run's result; examples marked for Excel and Power BI only are shown without output. How content is tested.
Keep reading
- Power Query vs VBA macros: when to switchWhen to replace a VBA macro with Power Query: which data jobs move across, which still need VBA, and how to migrate a macro without breaking the report.
- Transform in SQL, Power Query or DAX? Where each step belongsDecide whether a Power BI transformation belongs in the SQL source, in Power Query or in DAX, with a placement table, tested M examples and the ratio trap.
- How to clean a messy CRM export in Power QueryClean a CRM export in Power Query: tidy names and emails, turn blanks into null, map country spellings, remove duplicate contacts and list problem rows.
Practise Power Query in the browser with graded exercises checked against fresh data.
Power Query Exercises is an independent educational platform and is not affiliated with, endorsed by, sponsored by, or approved by Microsoft Corporation. All third-party trademarks belong to their respective owners.