Allocate shared costs across departments with Power Query
Use case · By Tahir Nas · Examples run in our simulator · Updated
11 min read
To allocate shared costs across departments in Power Query, keep each department's drivers (headcount, floor area and so on) in a table and turn each driver into shares that add up to 1. Merge the shared costs onto those shares by driver so every cost spreads across every department. Then round each line, push any rounding difference onto one line, and check that the allocated total equals the cost pool before the result goes anywhere.
What cost allocation and drivers mean
Shared costs such as rent, insurance and IT support are paid centrally but used by several departments. Allocating them means splitting each cost in proportion to something that reflects use, called a driver: floor area for rent, headcount for IT support. Which driver suits which cost is a management accounting decision. Power Query's job is to apply the chosen drivers the same way every month and show its working.
The examples use three costs (rent 12,000, IT support 6,000 and insurance 2,500, a pool of 20,500) and four departments: Sales, Operations, Finance and IT.
One cost, one driver
The simplest case is one cost spread by one driver: IT support by headcount. Total the driver, divide each department's value by the total to get its share, and multiply.
let
    ITSupport = 6000,
    Headcount = #table(
        type table [Department = text, Staff = number],
        {{"Sales", 12}, {"Operations", 20}, {"Finance", 5}, {"IT", 3}}
    ),
    Total = List.Sum(Headcount[Staff]),
    Share = Table.AddColumn(Headcount, "Share", each [Staff] / Total, type number),
    Allocated = Table.AddColumn(Share, "IT support", each Number.Round(ITSupport * [Share], 2), type number)
in
    Allocated
Result
| Department | Staff | Share | IT support |
|---|---|---|---|
| Sales | 12 | 0.3 | 1800 |
| Operations | 20 | 0.5 | 3000 |
| Finance | 5 | 0.125 | 750 |
| IT | 3 | 0.075 | 450 |
Output produced by the Power Query Exercises simulator, an independent implementation of a documented subset of M.
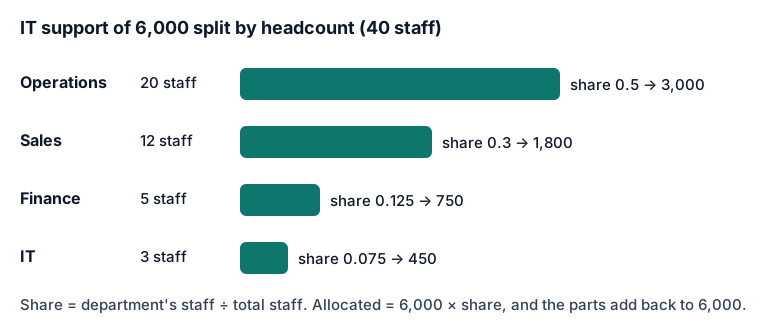
With 40 staff in total, Operations has 20 and a share of 0.5, so it takes 3,000 of the 6,000. Sales takes 1,800 (0.3), Finance 750 (0.125) and IT 450 (0.075). Total is its own step, not inside the each, so it is computed once rather than once per row. The lesson on all-rows grouping and per-group calculations shows the same share-of-total idea within groups, and the exercise on each region's share of total revenue practises it.
Several costs, each with its own driver
Real allocations have several costs, each with its own driver. Two tables keep this maintainable:
- Costs: one row per cost, with its amount and the name of its driver.
- Drivers: one row per department, with one column per driver.
The query unpivots the drivers so each row is department, driver name and value, works out each department's share of each driver, and then merges the costs onto the shares by driver name.
let
    Costs = #table(
        type table [Cost = text, Amount = number, Driver = text],
        {{"Rent", 12000, "Floor area"}, {"IT support", 6000, "Headcount"}, {"Insurance", 2500, "Floor area"}}
    ),
    Drivers = #table(
        type table [Department = text, Headcount = number, #"Floor area" = number],
        {{"Sales", 12, 180}, {"Operations", 20, 520}, {"Finance", 5, 60}, {"IT", 3, 40}}
    ),
    DriversLong = Table.UnpivotOtherColumns(Drivers, {"Department"}, "Driver", "Value"),
    Totals = Table.Group(DriversLong, {"Driver"}, {{"DriverTotal", each List.Sum([Value]), type number}}),
    WithTotals = Table.NestedJoin(DriversLong, {"Driver"}, Totals, {"Driver"}, "T", JoinKind.Inner),
    ExpandedTotals = Table.ExpandTableColumn(WithTotals, "T", {"DriverTotal"}),
    Shares = Table.AddColumn(ExpandedTotals, "Share", each [Value] / [DriverTotal], type number),
    Joined = Table.NestedJoin(Costs, {"Driver"}, Shares, {"Driver"}, "S", JoinKind.LeftOuter),
    Expanded = Table.ExpandTableColumn(Joined, "S", {"Department", "Share"}),
    Allocated = Table.AddColumn(Expanded, "Allocated", each Number.Round([Amount] * [Share], 2), type number),
    Result = Table.SelectColumns(Allocated, {"Cost", "Department", "Driver", "Share", "Allocated"})
in
    Result
Result
| Cost | Department | Driver | Share | Allocated |
|---|---|---|---|---|
| Rent | Sales | Floor area | 0.225 | 2700 |
| Rent | Operations | Floor area | 0.65 | 7800 |
| Rent | Finance | Floor area | 0.075 | 900 |
| Rent | IT | Floor area | 0.05 | 600 |
| IT support | Sales | Headcount | 0.3 | 1800 |
| IT support | Operations | Headcount | 0.5 | 3000 |
| IT support | Finance | Headcount | 0.125 | 750 |
| IT support | IT | Headcount | 0.075 | 450 |
| Insurance | Sales | Floor area | 0.225 | 562.5 |
| Insurance | Operations | Floor area | 0.65 | 1625 |
| Insurance | Finance | Floor area | 0.075 | 187.5 |
| Insurance | IT | Floor area | 0.05 | 125 |
Output produced by the Power Query Exercises simulator, an independent implementation of a documented subset of M.
The result has 12 rows: three costs times four departments. Floor area totals 800, so Operations (520) has a share of 0.65 and takes 7,800 of the rent and 1,625 of the insurance. IT support follows headcount, so Operations takes 3,000 of it.
| Cost | Department | Driver | Share | Allocated |
|---|---|---|---|---|
| Rent | Sales | Floor area | 0.225 | 2,700 |
| Rent | Operations | Floor area | 0.65 | 7,800 |
| IT support | Sales | Headcount | 0.3 | 1,800 |
| IT support | Operations | Headcount | 0.5 | 3,000 |
| Insurance | Operations | Floor area | 0.65 | 1,625 |
The table shows five of the 12 rows. A few details matter:
Table.UnpivotOtherColumnskeepsDepartmentand unpivots every other column (Table.UnpivotOtherColumns, Microsoft Learn). Add a "Power usage" column to the drivers table and a cost that names it, and the query picks both up with no edits.Table.Groupbuilds one row per driver with its total (Table.Group, Microsoft Learn). Merging that back gives every department row its driver total.- The merge of costs onto shares is one-to-many on purpose. Usually a merge that multiplies rows is a mistake, which is what the join explosion glossary entry warns about. Here, one row per cost per department is exactly the output you want. The lesson on predicting row counts after a merge explains how to know in advance: 3 costs times 4 departments is 12.
- The driver name in the costs table must match the column header exactly, including case. Names in M are compared case-sensitively, the same trap that case sensitivity and missing matches covers for merges. "Floor Area" would match nothing, and with a left outer join that cost would come through with a null department.
Summarise by department and check it ties out
The allocation is only useful if it adds back to the cost pool. Group the allocated lines by department, then compare the grand total with the sum of the costs. If they differ, stop the refresh with a message.
let
    Costs = #table(
        type table [Cost = text, Amount = number, Driver = text],
        {{"Rent", 12000, "Floor area"}, {"IT support", 6000, "Headcount"}, {"Insurance", 2500, "Floor area"}}
    ),
    Drivers = #table(
        type table [Department = text, Headcount = number, #"Floor area" = number],
        {{"Sales", 12, 180}, {"Operations", 20, 520}, {"Finance", 5, 60}, {"IT", 3, 40}}
    ),
    DriversLong = Table.UnpivotOtherColumns(Drivers, {"Department"}, "Driver", "Value"),
    Totals = Table.Group(DriversLong, {"Driver"}, {{"DriverTotal", each List.Sum([Value]), type number}}),
    WithTotals = Table.NestedJoin(DriversLong, {"Driver"}, Totals, {"Driver"}, "T", JoinKind.Inner),
    ExpandedTotals = Table.ExpandTableColumn(WithTotals, "T", {"DriverTotal"}),
    Shares = Table.AddColumn(ExpandedTotals, "Share", each [Value] / [DriverTotal], type number),
    Joined = Table.NestedJoin(Costs, {"Driver"}, Shares, {"Driver"}, "S", JoinKind.LeftOuter),
    Expanded = Table.ExpandTableColumn(Joined, "S", {"Department", "Share"}),
    Allocated = Table.AddColumn(Expanded, "Allocated", each Number.Round([Amount] * [Share], 2), type number),
    ByDept = Table.Group(Allocated, {"Department"}, {{"Allocated", each List.Sum([Allocated]), type number}}),
    Difference = Number.Round(List.Sum(Costs[Amount]) - List.Sum(ByDept[Allocated]), 2),
    Result = if Difference = 0 then ByDept else error "Allocation is out by " & Number.ToText(Difference)
in
    Result
Result
| Department | Allocated |
|---|---|
| Sales | 5062.5 |
| Operations | 12425 |
| Finance | 1837.5 |
| IT | 1175 |
Output produced by the Power Query Exercises simulator, an independent implementation of a documented subset of M.
| Department | Allocated |
|---|---|
| Sales | 5,062.5 |
| Operations | 12,425 |
| Finance | 1,837.5 |
| IT | 1,175 |
The four departments add up to 20,500, the full cost pool, so the check passes. A cost whose driver name matches no driver column would come through with a null department, leave the total short and stop the refresh. The lesson on validating data and failing loudly covers this kind of control.
Rounding differences
The numbers above divide neatly. Most real allocations don't. Split 1,000 equally across three departments, round each to pence, and the three lines add up to 999.99. The allocation is a penny short, and the tie-out check above would stop the refresh. Which way halves round matters too; tiered sales commission compares the Number.Round rounding modes.
One common fix is to put the rounding difference on one line, typically the department with the largest share, so the total is exact. Table.ReplaceValue accepts a custom replacer function, which lets it change a value only on rows that meet a condition (Table.ReplaceValue, Microsoft Learn).
let
    Pool = 1000,
    Drivers = #table(type table [Department = text, Staff = number], {{"Sales", 1}, {"Operations", 1}, {"Finance", 1}}),
    Total = List.Sum(Drivers[Staff]),
    Rounded = Table.AddColumn(Drivers, "Allocated", each Number.Round(Pool * [Staff] / Total, 2), type number),
    Difference = Number.Round(Pool - List.Sum(Rounded[Allocated]), 2),
    Largest = Table.Max(Rounded, "Staff")[Department],
    Fixed = Table.ReplaceValue(Rounded, each [Department] = Largest, Difference,
        (current, isLargest, diff) => if isLargest then Number.Round(current + diff, 2) else current, {"Allocated"})
in
    Fixed
Result
| Department | Staff | Allocated |
|---|---|---|
| Sales | 1 | 333.34 |
| Operations | 1 | 333.33 |
| Finance | 1 | 333.33 |
Output produced by the Power Query Exercises simulator, an independent implementation of a documented subset of M.
Sales gets 333.34 and the other two 333.33, which adds to exactly 1,000. All three have the same headcount here, so Table.Max has a tie; the simulator returns the first row, but Microsoft's documentation doesn't define a tie rule, so sort the table and take the first row if the choice must be predictable. In real data the penny lands on the largest department, where it matters least. In the multi-cost query the same fix applies per cost; in outline, group by Cost with an all-rows aggregation, apply the steps above to each group, then expand, so each cost ties out on its own. Number.Round uses banker's rounding by default, which the rounding lesson explains; the difference fix works the same with either rounding mode.
When a driver total is zero
If every department reports zero for a driver (no floor area recorded yet, say), each share is 0 divided by 0. M doesn't raise an error for that. Number division follows floating-point rules, and the M language specification lists 0 / 0 as #nan (M language operators, Microsoft Learn). The allocation would load as NaN with no warning. Check the total first:
let
    Pool = 6000,
    Drivers = #table(type table [Department = text, Staff = number], {{"Sales", 0}, {"Operations", 0}}),
    Total = List.Sum(Drivers[Staff]),
    Allocated = Table.AddColumn(Drivers, "Allocated", each Number.Round(Pool * [Staff] / Total, 2), type number),
    Result = if Total = 0 then error "Driver total is zero, so there is nothing to allocate on" else Allocated
in
    Result
Result: an error
Expression.Error: Driver total is zero, so there is nothing to allocate on
Output produced by the Power Query Exercises simulator, an independent implementation of a documented subset of M.
The simulator raises Driver total is zero, so there is nothing to allocate on. Without the check, the same query returns NaN in both rows. In the multi-cost query, the equivalent check is that no driver named in Costs has a DriverTotal of zero. Without it, the tie-out check would still fail, but with the less helpful message that the allocation is out by NaN.
Keep the inputs in workbook tables
In practice, the costs come from the ledger (for example, the month's totals for the rent, insurance and IT support accounts) and the drivers from HR and facilities (a monthly HR headcount report gives headcount by department). Keep each in an Excel table or its own query, reference them from the allocation query, and the monthly routine becomes: update the cost and driver tables (or let the ledger query refresh), then refresh. The lesson on referencing other queries for staging and reuse shows how to split source and logic. Allocated costs often feed a budget vs actual report, where the merge-on-department pattern appears again.
Frequently asked questions
Should the allocation be calculated in Power Query or in DAX?
For a fixed monthly allocation that is posted or reported as numbers, Power Query is a good fit: the result is a table you can check and load. If users need to change drivers and see the effect interactively, a DAX model may suit better. The post on transforming in SQL, Power Query or DAX sets out the wider split. Either way, keep drivers in a table rather than in formulas.
What if one cost seems to need more than one driver?
That usually means it is really two costs. Split it in the costs table (for example "IT support: hardware" by headcount and "IT support: hosting" by a usage measure) so each line has one driver and the query stays the same.
How do I allocate in steps, such as IT costs to departments that then pass on to products?
Run the allocation twice. The first query allocates shared costs to departments; a second query uses that output as its cost table (renamed to Cost and Amount, with a Driver column added) and a product-level driver table. Keeping each step as its own query makes each tie-out check easy to read. Power Query Exercises has more merge and grouping practice in its exercise library if you want to rehearse the pattern.
Sources
- Table.UnpivotOtherColumns, Microsoft Learn (learn.microsoft.com)
- Table.Group, Microsoft Learn (learn.microsoft.com)
- Table.ReplaceValue, Microsoft Learn (learn.microsoft.com)
- M language operators, Microsoft Learn (learn.microsoft.com)
About the author
Tahir Nas, software engineer, writes and reviews the lessons, guides and exercises on Power Query Exercises. Tahir has 8 years of experience in tech, working across system administration, cloud architecture, QA, scripting and automation, and software engineering in many languages and mainstream databases. GitHub profile. Every M example shown with a result was run in the site's simulator when the page was built, and the output is that run's result; examples marked for Excel and Power BI only are shown without output. How content is tested.
Keep reading
- Currency conversion with an exchange-rate table in Power QueryConvert foreign-currency amounts in Power Query: merge a monthly or daily rate table, take the last rate on or before each date, and round with intent.
- Budget vs actual reporting with Power QueryBuild a budget vs actual report in Power Query: unpivot a wide budget, total actuals by month, full outer join both sides, then label variances correctly.
- Build a monthly HR headcount report with Power QueryTurn an employee list with start and leave dates into month-end headcount, FTE by department, and starters and leavers that reconcile, using Power Query.
Practise Power Query in the browser with graded exercises checked against fresh data.
Power Query Exercises is an independent educational platform and is not affiliated with, endorsed by, sponsored by, or approved by Microsoft Corporation. All third-party trademarks belong to their respective owners.