Unpivot columns in Power Query: a refresh-proof guide
Guide · By Tahir Nas · Examples run in our simulator · Published · Updated
When you need it
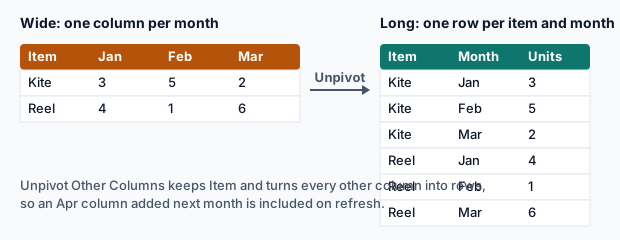
Budgets, forecasts and survey exports put one period or question per column. That's easy to read and hard to analyse: you can't filter 'March to May' or chart a trend without a formula per column. Unpivoting turns the column headers into a column of values, so each row becomes one item in one period.
The five-step recipe
- Remove any total columns (Total, YTD, Average) or plan to filter them out after the unpivot.
- Select the identifier columns (Account, Item, Store…).
- Choose Transform → Unpivot Columns → Unpivot Other Columns.
- Rename Attribute and Value to meaningful names in the same step.
- Convert the attribute to a real type (often a date) and set the value type.
let
    Forecast = #table({"Store", "Product", "2026-07", "2026-08", "2026-09", "Total"}, {
        {"Leeds", "Kite", 40, 55, null, 95},
        {"York", "Kite", 22, 18, 30, 70}
    }),
    Long = Table.UnpivotOtherColumns(Forecast, {"Store", "Product"}, "Period", "Units"),
    NoTotals = Table.SelectRows(Long, each [Period] <> "Total"),
    Typed = Table.TransformColumns(NoTotals, {{"Period", each Date.FromText(_ & "-01"), type date}})
in
    Typed
Result
| Store | Product | Period | Units |
|---|---|---|---|
| Leeds | Kite | 2026-07-01 | 40 |
| Leeds | Kite | 2026-08-01 | 55 |
| York | Kite | 2026-07-01 | 22 |
| York | Kite | 2026-08-01 | 18 |
| York | Kite | 2026-09-01 | 30 |
Output produced by the Power Query Exercises simulator, an independent implementation of a documented subset of M.
Prove it survives a refresh
The point of Unpivot Other Columns is what happens next month. Test it: add a column to the source and check the output has the new period without any edit to the query. If you used Unpivot Only Selected Columns, the new column would stay wide.
let
    NextRefresh = #table({"Store", "Product", "2026-07", "2026-08", "2026-09", "2026-10"}, {{"Leeds", "Kite", 40, 55, 12, 61}}),
    Long = Table.UnpivotOtherColumns(NextRefresh, {"Store", "Product"}, "Period", "Units")
in
    Table.RowCount(Long)
Result
4
Output produced by the Power Query Exercises simulator, an independent implementation of a documented subset of M.
Blanks, zeros and duplicates
- Unpivot drops null cells. If the report must show a row for every period, merge the long table onto a full list of periods afterwards.
- Zero is a value, so a 0 cell does produce a row.
- If two identifier columns are missing from the selection, rows that look different may collapse into the same key later; keep every column that identifies a row in the selection.
Practise it in the simulator
Each task opens the exact exercise in the browser workspace and is checked against fresh data, not just the example. These tasks are part of Pro.
Related pages
Lessons
Function reference
Sources
Microsoft's official documentation for the features and functions used on this page.
- Unpivot columns (Concept, Microsoft Learn)
- Pivot columns (Concept, Microsoft Learn)
- Table.UnpivotOtherColumns (Function reference, Microsoft Learn)
- Table.SelectRows (Function reference, Microsoft Learn)
- Table.TransformColumns (Function reference, Microsoft Learn)
- Date.FromText (Function reference, Microsoft Learn)
- Table.RowCount (Function reference, Microsoft Learn)
Power Query Exercises is an independent educational platform and is not affiliated with, endorsed by, sponsored by, or approved by Microsoft Corporation. All third-party trademarks belong to their respective owners.