Power Query row count is wrong? How to find where rows go missing
Troubleshooting · By Tahir Nas · Examples run in our simulator · Updated
11 min read
When a Power Query result has fewer rows than the source, one step is removing them, and you find it by counting rows after each step until the number drops. Once you know the step, an anti join against the step before it lists exactly which rows went, and the cause is usually one of five things: a filter meeting null, text that only looks equal, an inner merge with unmatched keys, Remove Errors after a type change, or Remove Duplicates on too few columns.
Count rows after every step
The fastest way to locate the problem is to stop guessing and measure. Every step in a query is a named value, so you can reference any of them from a later step. Table.RowCount returns the number of rows in a table (Table.RowCount, Microsoft Learn), and a #table of step names and counts turns the whole query into a one-screen audit.
The example below has five orders. It keeps completed orders, keeps positive amounts, then merges to a customer list with an inner join.
let
    Source = #table({"OrderID", "Status", "Amount", "CustomerID"}, {
        {"A1", "Complete", 120, "C1"},
        {"A2", "complete ", 80, "C2"},
        {"A3", "Complete", null, "C3"},
        {"A4", "Complete", 45, "C9"},
        {"A5", "Complete", 60, "C1"}
    }),
    Customers = #table({"CustomerID", "City"}, {{"C1", "Leeds"}, {"C2", "York"}, {"C3", "Hull"}}),
    Completed = Table.SelectRows(Source, each [Status] = "Complete"),
    Positive = Table.SelectRows(Completed, each [Amount] > 0),
    Merged = Table.NestedJoin(Positive, {"CustomerID"}, Customers, {"CustomerID"}, "Cust", JoinKind.Inner),
    Counts = #table({"Step", "Rows"}, {
        {"Source", Table.RowCount(Source)},
        {"Completed", Table.RowCount(Completed)},
        {"Positive", Table.RowCount(Positive)},
        {"Merged", Table.RowCount(Merged)}
    })
in
    Counts
Result
| Step | Rows |
|---|---|
| Source | 5 |
| Completed | 4 |
| Positive | 3 |
| Merged | 2 |
Output produced by the Power Query Exercises simulator, an independent implementation of a documented subset of M.
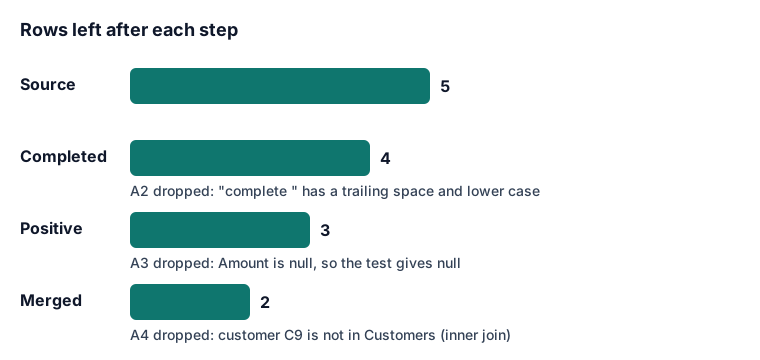
The counts go 5, 4, 3, 2. Every step after Source loses one row, and each loss has a different cause. In a real query you would add the Counts step temporarily at the end, read it, then delete it. Clicking through Applied Steps works too, but the editor shows a preview, and a table of counts is easier to compare and easy to paste into a ticket.
Two habits make this work on a large query:
- Count at the steps that can change the number of rows: filters, merges, expands, Remove Duplicates, Remove Errors, Keep or Remove Rows, Group By and appends. Renames and type changes never change the count.
- Write down the count you expect before you look. A step that keeps 9,950 of 10,000 rows is only wrong if you expected 10,000.
The lesson on debugging a broken query step by step uses the same idea for errors: walk the steps in order and look at what each one returns.
List the exact rows a step removed
A count tells you where. To see which rows, compare the table before the step with the table after it. A left anti join keeps only the rows from the left table that have no match in the right table (Left anti join, Microsoft Learn), so joining "before" to "after" on a key that identifies each row leaves exactly the dropped rows.
let
    Before = #table({"OrderID", "Status"}, {{"A1", "Complete"}, {"A2", "complete "}, {"A3", "Complete"}}),
    After = Table.SelectRows(Before, each [Status] = "Complete"),
    Dropped = Table.NestedJoin(Before, {"OrderID"}, After, {"OrderID"}, "Match", JoinKind.LeftAnti),
    Result = Table.RemoveColumns(Dropped, {"Match"})
in
    Result
Result
| OrderID | Status |
|---|---|
| A2 | complete |
Output produced by the Power Query Exercises simulator, an independent implementation of a documented subset of M.
The result is the one row the filter removed: A2, whose status is "complete " with a lower-case c and a trailing space. That is usually enough to name the cause. If the table has no single identifying column, add an index column at the source first (Add index columns) and join on that.
The five usual causes
Once you can see the missing rows, the cause tends to fall into one of these groups.
A filter that meets null
Table.SelectRows returns the rows that match the condition (Table.SelectRows, Microsoft Learn). A row matches only when the condition returns true. Comparing null with a number returns null, so the row is dropped even though nobody asked for blanks to go.
let
    Source = #table({"OrderID", "Amount"}, {{"A1", 120}, {"A2", null}, {"A3", -5}}),
    Check = Table.AddColumn(Source, "Kept", each [Amount] > 0)
in
    Check
Result
| OrderID | Amount | Kept |
|---|---|---|
| A1 | 120 | true |
| A2 | null | null |
| A3 | -5 | false |
Output produced by the Power Query Exercises simulator, an independent implementation of a documented subset of M.
The Kept column shows true for A1, null for A2 and false for A3. Both A2 and A3 leave the table. If missing amounts should stay, say so in the condition:
let
    Source = #table({"OrderID", "Amount"}, {{"A1", 120}, {"A2", null}, {"A3", -5}}),
    Kept = Table.SelectRows(Source, each [Amount] = null or [Amount] > 0)
in
    Kept
Result
| OrderID | Amount |
|---|---|
| A1 | 120 |
| A2 | null |
Output produced by the Power Query Exercises simulator, an independent implementation of a documented subset of M.
This keeps A1 and A2. The guide on null, empty text and errors in filters covers the same trap with <> and empty strings, and the exercise predict which orders a filter will drop, nulls included is good practice before you trust a filter on live data.
Text that only looks equal
Text comparison in M is exact. "Complete", "complete" and "Complete " are three different values, so a filter or a merge key written for one misses the others. Grouping the column by value shows the variants at a glance:
let
    Source = #table({"Status"}, {{"Complete"}, {"complete "}, {"Complete"}, {null}}),
    Profile = Table.Group(Source, {"Status"}, {{"Rows", each Table.RowCount(_), Int64.Type}})
in
    Profile
Result
| Status | Rows |
|---|---|
| Complete | 2 |
| complete | 1 |
| null | 1 |
Output produced by the Power Query Exercises simulator, an independent implementation of a documented subset of M.
The result has three groups: "Complete" with 2 rows, "complete " with 1 and null with 1. The column distribution and column profile tools in the editor give the same picture, but by default they profile only the first 1,000 rows (Data profiling tools, Microsoft Learn), so a rare variant further down can hide. Switch to "Column profiling based on entire data set" when you are hunting for one.
The fix is to clean the column before the filter, not to add more conditions to it:
let
    Source = #table({"Status"}, {{"Complete"}, {"complete "}, {"Complete"}}),
    Clean = Table.TransformColumns(Source, {{"Status", each Text.Proper(Text.Trim(_)), type text}}),
    Kept = Table.SelectRows(Clean, each [Status] = "Complete")
in
    Table.RowCount(Kept)
Result
3
Output produced by the Power Query Exercises simulator, an independent implementation of a documented subset of M.
All 3 rows are kept. Text.Proper rewrites the casing of every value, which is fine for a status label but not for codes whose case you need to keep. The lesson Trim, clean and capitalise text covers the cleaning functions, and case sensitivity in Power Query goes deeper on case in merges.
An inner merge with keys that don't match
An inner join keeps only rows that find a partner. Any order whose customer ID is missing from the customer table, or spelt differently, disappears. Run the same merge as a left anti join to list the orphans before deciding what to do with them:
let
    Orders = #table({"OrderID", "CustomerID"}, {{"A1", "C1"}, {"A2", "C2 "}, {"A3", "c3"}}),
    Customers = #table({"CustomerID", "City"}, {{"C1", "Leeds"}, {"C2", "York"}, {"C3", "Hull"}}),
    Unmatched = Table.NestedJoin(Orders, {"CustomerID"}, Customers, {"CustomerID"}, "Cust", JoinKind.LeftAnti),
    Result = Table.RemoveColumns(Unmatched, {"Cust"})
in
    Result
Result
| OrderID | CustomerID |
|---|---|
| A2 | C2 |
| A3 | c3 |
Output produced by the Power Query Exercises simulator, an independent implementation of a documented subset of M.
A2 ("C2 " with a trailing space) and A3 (c3 in lower case) have no match. Some unmatched rows are genuine (a customer not yet in the master list), and those are better kept with a left outer join so the totals still add up. Others are dirty keys, and the fix is to clean both sides. A code stored as text on one side and as a number on the other fails the same way, as in merges that lose leading zeros. The lesson on choosing a join kind explains which join keeps what, and the exercise clean both keys before merging practises the clean-up. Merges can also go wrong the other way and add rows; predicting row counts after a merge covers duplicates on the right-hand side.
Remove Errors after a type change
When a Changed Type step meets a value it can't convert, that cell becomes an error. Microsoft's guide describes these as cell-level errors and lists Remove errors as one way to handle them, which removes the whole row (Dealing with errors, Microsoft Learn). A Remove Errors step added once to tidy the preview keeps silently removing rows on every refresh. To keep the rows and record why each value failed, use try … catch instead. Before removing errors, look at them:
let
    Source = #table({"OrderID", "Qty"}, {{"A1", "3"}, {"A2", "three"}, {"A3", "5"}}),
    Typed = Table.TransformColumnTypes(Source, {{"Qty", Int64.Type}}),
    Errors = Table.SelectRowsWithErrors(Typed, {"Qty"})
in
    Errors
Result
| OrderID | Qty |
|---|---|
| A2 | Error: DataFormat.Error: We couldn't convert to Whole Number. |
Output produced by the Power Query Exercises simulator, an independent implementation of a documented subset of M.
The result is A2, with the simulator's error "We couldn't convert to Whole Number." (the DataFormat.Error page explains it). Table.SelectRowsWithErrors returns only the rows that contain an error in the columns you list (Table.SelectRowsWithErrors, Microsoft Learn), which is what Keep errors does. If the value should be kept, replace the error or fix the conversion instead; the lesson Find, remove and replace errors shows each option, and the exercise replace bad quantities with null and flag them keeps the row and records the problem.
Remove Duplicates on too few columns
Remove Duplicates on one selected column keeps one row per value in that column and drops every other row, even when the other columns differ. Table.Distinct tests only the columns you name (Table.Distinct, Microsoft Learn):
let
    Source = #table({"Customer", "OrderDate", "Amount"}, {{"C1", #date(2026, 10, 1), 100}, {"C1", #date(2026, 10, 8), 250}, {"C2", #date(2026, 10, 3), 75}}),
    Deduped = Table.Distinct(Source, {"Customer"})
in
    Deduped
Result
| Customer | OrderDate | Amount |
|---|---|---|
| C1 | 2026-10-01 | 100 |
| C2 | 2026-10-03 | 75 |
Output produced by the Power Query Exercises simulator, an independent implementation of a documented subset of M.
Customer C1's second order (250 on 8 October) is gone. Microsoft's page also warns that there is no guarantee which duplicate is preserved unless the table is buffered first. If the aim was one row per order, the key is the order, not the customer. The lesson Remove duplicates on the right key works through choosing the key.
Other steps that cut rows
A few more steps change the count and are worth checking when the five causes above don't fit:
| Step | How rows go missing |
|---|---|
| Keep Top Rows, Remove Top Rows, Remove Bottom Rows | A fixed number written when the file had a different layout. Next month's banner has one line more or less. |
| Promote Headers | The first row becomes the header, so the count drops by one. Expected, but easy to forget when reconciling. |
| Remove Blank Rows | Drops rows where every value is null or empty, which can include spacer rows a later fill-down step expected to see. |
| Group By | Collapses rows on purpose. Compare the group count to distinct keys, not to the source row count. |
| Expand of a table column after a merge | Doesn't remove rows by itself (a row with no match gets nulls), but the inner join before it may already have. |
For fixed counts in banner and footer removal, the lesson Remove report banners before promoting headers shows how to find the header row by content rather than position. The post on why Excel reports break every month covers banner rows among other monthly changes.
Make the check part of the query
A count you read once protects one refresh. A check inside the query protects all of them. Where a step must not lose rows, compare the counts and raise an error when they differ:
let
    Orders = #table({"OrderID", "CustomerID"}, {{"A1", "C1"}, {"A2", "C2 "}, {"A3", "C3"}}),
    Customers = #table({"CustomerID", "City"}, {{"C1", "Leeds"}, {"C2", "York"}, {"C3", "Hull"}}),
    Merged = Table.NestedJoin(Orders, {"CustomerID"}, Customers, {"CustomerID"}, "Cust", JoinKind.Inner),
    Checked = if Table.RowCount(Merged) <> Table.RowCount(Orders)
        then error Error.Record("RowCountCheck", "Merge dropped rows", [Before = Table.RowCount(Orders), After = Table.RowCount(Merged)])
        else Merged
in
    Checked
Result: an error
RowCountCheck: Merge dropped rows
Output produced by the Power Query Exercises simulator, an independent implementation of a documented subset of M.
The refresh stops with "Merge dropped rows" and a record of both counts, which is a better outcome than a report that is quietly short by one order. The lesson Validate data and fail loudly covers other checks of this kind, such as required columns and unique keys.
Frequently asked questions
Why does the row count in the editor differ from the rows loaded to Excel?
The editor works on a preview, and the profiling tools look at the first 1,000 rows unless you switch them to the entire data set. The loaded table is the result of a full refresh. If the numbers still differ after a refresh, count rows inside the query with Table.RowCount on the final step, which runs against the full data.
How do I find missing rows when there is no ID column?
Add an index column on the Source step, before any filter or merge. The index survives later steps, so an anti join on it between any two steps lists the rows that went missing in between.
Should I just replace the inner join with a left join?
Only if the unmatched rows belong in the result. A left outer join keeps them with nulls in the lookup columns, which keeps totals correct but can hide dirty keys. List the unmatched rows first, clean the keys that are wrong, then choose the join for the rows that are left.
To practise all of this on realistic data, the Power Query Exercises challenge find orders from unknown customers asks you to list the orders an inner merge would lose, and it checks your answer in the browser.
Sources
- Table.RowCount, Microsoft Learn (learn.microsoft.com)
- Left anti join, Microsoft Learn (learn.microsoft.com)
- Table.SelectRows, Microsoft Learn (learn.microsoft.com)
- Data profiling tools, Microsoft Learn (learn.microsoft.com)
- Dealing with errors, Microsoft Learn (learn.microsoft.com)
- Table.SelectRowsWithErrors, Microsoft Learn (learn.microsoft.com)
- Table.Distinct, Microsoft Learn (learn.microsoft.com)
About the author
Tahir Nas, software engineer, writes and reviews the lessons, guides and exercises on Power Query Exercises. Tahir has 8 years of experience in tech, working across system administration, cloud architecture, QA, scripting and automation, and software engineering in many languages and mainstream databases. GitHub profile. Every M example shown with a result was run in the site's simulator when the page was built, and the output is that run's result; examples marked for Excel and Power BI only are shown without output. How content is tested.
Keep reading
- Case sensitivity in Power Query: the silent cause of missing matchesPower Query treats upper and lower case as different, so Ben@Shop.com won't match ben@shop.com. Fix merges, filters and groups with a key or a comparer.
- CSV quirks in Power Query: line breaks, quotes and delimiters inside valuesFix CSV imports that split rows or shift columns: quoted line breaks, commas inside values, doubled quotes, semicolon files and the fixed column count.
- Why dates turn into numbers after Power Query loads to ExcelDates that load to Excel as 46296 are Excel serial numbers. Find the untyped column in Power Query, set a Date type, and stop the table losing its format.
Practise Power Query in the browser with graded exercises checked against fresh data.
Power Query Exercises is an independent educational platform and is not affiliated with, endorsed by, sponsored by, or approved by Microsoft Corporation. All third-party trademarks belong to their respective owners.